Monitoring
How to Become a Financial Analyst: A Step-By-Step Roadmap
Lorem ipsum dolor sit amet, consectetur adipiscing elit, sed do eiusmod tempor incididunt ut labore et dolore magna...

In October 2025, STATEC, Luxembourg’s national statistics office, organized the Hackathon in partnership with the GovTech Lab: a 3-day event during which teams of 4 to 6 volunteers had to address a topic announced on the first day.
The teams were given complete freedom regarding their final outputs, as long as they met certain objectives assessed through transparent criteria communicated during the initial presentation. The objective was therefore to develop a dashboard based on public data, presenting the effects of the ageing of the Luxembourgish population on society and the economy.
The evaluation criteria allowing for a fair and equitable assessment were then defined as follows:
The team of volunteers representing Artemis was composed of 5 experts:
The creation of this team brought together a broad range of skills, from IT development to more transversal skills such as economics, as well as data analysis, data science, and data management.
Kevin Alati
Data tech lead — Data scientist
Christophe Boutron
IT Expert — System and network administrator
Sandrine Herbeth
Project Manager — Business Development Manager
Mathieu Scheffer
Data scientist
Quentin Schmidt
Economist — Data scientist
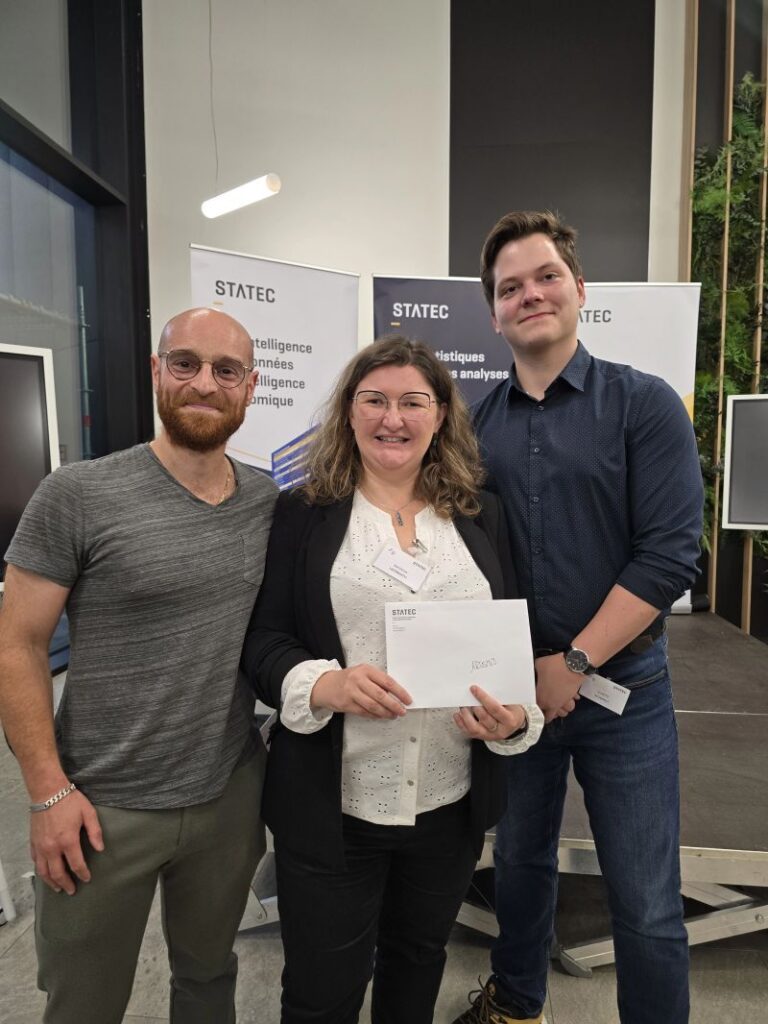
Thanks to the team's multidisciplinary skills (due to the fact that Artemis is involved both in evaluation and in official data); the mixed approach was a success, allowing Artemis to win 4th place, a victory given that it received more or less the same prize as the 3rd-place team, and given that it ranked highest among the private companies that participated. All the other teams were composed of academics / researchers linked to public organizations.
The approach was based on a mixed approach relying on 2 of Artemis’s 3 dimensions, its experience in evaluation and its experience with official data:
In evaluation, an evaluation matrix is a tool designed to transparently and structurally present how to answer an evaluative question. Given the nature of the question, which may be considered a public policy or public action, the use of an evaluation methodology is relevant.
The matrix therefore presents the team's thought process in a transparent and reproducible way. The objective is also to avoid as much as possible potential biases directing the answers in one direction or another.
The matrix normally guides the evaluation in its entirety. Due to the relatively short duration of the event, the matrix used was significantly simplified compared with the matrices normally used.
Public debates increasingly put forward arguments to prove a point, but often without specifying the indicators / sources / methodologies used. This is why the dashboard had a specific objective: to allow Luxembourg citizens to quickly and effectively learn about the topic of ageing, as well as its impacts on Luxembourgish society and the economy. The main topics of concern were therefore presented in this dashboard, subsequently allowing STATEC to take a leading role in the public debate, presenting itself as THE reference.
The intended consequence was therefore to clarify debates with precise and sourced data, but also freely accessible on the STATEC website.
Luxembourg citizens could thus form an opinion based on facts, rather than biases or opinions.
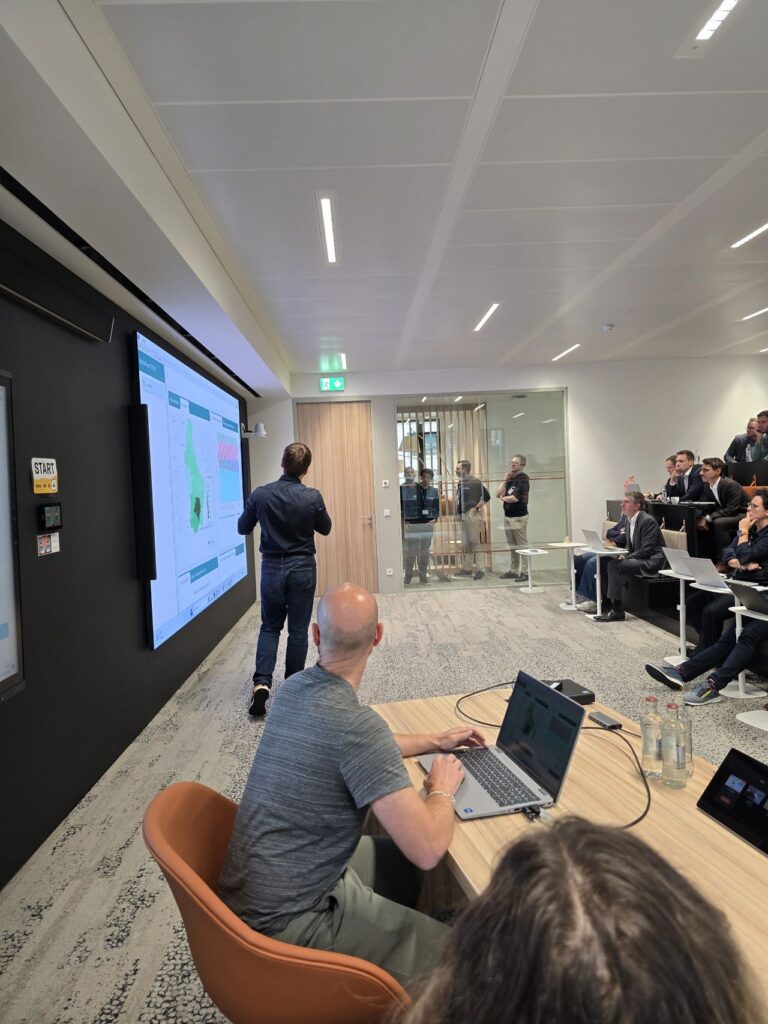
The presentation itself was given before a panel composed of STATEC unit managers as well as its current president: Tom HAAS.
Artemis's mixed approach is based on the experience of team members in two of Artemis's areas of intervention, namely project / public policy evaluation, as well as the management of official data.
The issue, the underlying questions, and the means of answering them therefore took the form of a simplified evaluation matrix, a practice used in both quantitative and qualitative evaluation. This approach is a key aspect of the team's and company's expertise, combining different types of analysis, data projections, and the ability to present, simplify, and popularize complex situations; the ageing of the Luxembourgish population thus becomes an issue that readers can understand.
The following simplified matrix addresses this simple issue: To what extent does the ageing of the Luxembourgish population impact society and the economy?
| Question | Hypothesis | Thematics | Indicator | Means | Dimension | Source |
|---|---|---|---|---|---|---|
| Is the Luxembourgish population ageing? | The Luxembourgish population has aged | Population | Median &/or average age | Map | Geospatial | Here |
| The rural population is older | Population | Age médian &/ou moyen | Map | Geospatial | Here | |
| Is the Luxembourgish population multicultural? | The foreign population is significant (size) | Population Immigration | Nationality | Map | Geospatial | Here |
| The foreign population is younger than the Luxembourgish population | Population | Nationality + Age | Map | Geospatial | Here | |
| Is the Luxembourgish population mainly rural? | Young people are in cities (Luxembourg City & Belval) | Population | Age + Pop | Map | Geospatial | Here |
| Does population ageing impact the economy as a whole? | Population ageing impacts the state budget | Health / Taxation | % Budget | Bar chart | Temporal | Here |
| The weight of pensions is significant | Taxation | — | — | Temporal | — | |
| The weight of healthcare is significant | Health | — | — | Temporal | — | |
| Luxembourg must prepare and take the lead | The share of the elderly population will increase | Population | Age | Line chart | Temporal + Projection | Here |
| Part of the expenditure leaves the Luxembourgish economy | Taxation | Population + residence | Line chart | Temporal + Projection | Here |
The selected indicators answer each of the underlying questions by presenting one facet of these impacts and consequences. The projections, although relatively simple to maintain a certain level of simplicity in understanding, facilitate the presentation of current and future challenges.
The second key point is then the online dashboard itself, resulting from the desire to popularise and simplify complex situations. In order to place this type of dashboard at the heart of discussions around this topic, as a reference and support for public debates, the dashboard is both customizable (and therefore adaptable), but also interactive (and therefore more comprehensive while remaining simple).
Furthermore, the dashboard follows the ethical rules in force established by international statistical organizations such as Eurostat. Combined with the use of open-source packages and software, and its constant online presence, the aim of being used as a primary reference and of giving users confidence is guaranteed.
The selection of the Dashboard's charts therefore depends on the available data; the team's experience with official data; and the simplified evaluation matrix described above.
This overall approach is nevertheless non-exhaustive, due to the short duration of the competition. The inclusion of econometric models was considered but ruled out due to a lack of time. Population projections come from STATEC, while pension projections are linear projections. Simplicity was prioritised in accordance with the team's objective.
The first thought when the topic was presented was to assess the extent of this demographic ageing, specifically in the very specific case of Luxembourg. The country's activities were until very recently heavily centred around Luxembourg City, with ageing possibly being more severe in more rural regions.
Immigration as well as cross-border workers are also an important topic regarding ageing in the discussions, particularly in order to determine whether the effects balance each other out.
Do past trends and future projections shed light on the evolution of the phenomenon, depending on possible changes in demographics (e.g. fertility and immigration)?
The first thought when the topic was presented was to assess the extent of this demographic ageing, specifically in the very specific case of Luxembourg. The country's activities were until very recently heavily centred around Luxembourg City, with ageing possibly being more severe in more rural regions.
Population aged 65 and over, by canton
Share of immigrant population, by canton
Immigration as well as cross-border workers are also an important topic regarding ageing in the discussions, particularly in order to determine whether the effects balance each other out.
Population aged 65 and over, by canton
Share of immigrant population, by canton
The geographical dimension therefore plays a predominant role in Luxembourg, and looking at the distinction between Luxembourg City and the rest of the country makes it possible to distinguish potential opposing trends. Furthermore, the country's position, between Belgium, France, and Germany, as well as its economic structure, led us to present immigration into Luxembourg, in order to compare population ageing with potentially one of its solutions. Whether immigration is a mechanism capable of reducing the extent of the ageing phenomenon and its impacts is often a subject debated in the public sphere.
Population Projection to 2100
Growth of the Population Aged 65 and Over
The second dimension in the extent of this ageing is whether the trend will continue, and to what extent? Official projections make it possible to address this question, while also incorporating scenarios. These scenarios, based on possible levels of immigration and fertility in Luxembourg, serve the function of “what if?”, thus moving away from a simplistic view of resolving ageing. Even under a perfect scenario for slowing down ageing, high fertility and high immigration, Luxembourg will have to adapt to this large-scale phenomenon.
The second dimension often raised during discussions about ageing is its potential impact on the government's public budget. Expenditure related to old age (healthcare, pensions, etc.) in the public budget leads to discussions around debt and the prioritization of expenditure, while the share of pensions paid to residents leads to consideration of domestic consumption.
Public Expenditure (%)
Public Expenditure (EUR million)
When discussing the budget allocated to ageing, it is easy to select or exclude certain parts in order to steer discussions in a particular direction. Nevertheless, addressing only pensions when describing ageing is reductive; healthcare is an expenditure category strongly correlated with the average age of the population. This is why we decided to aggregate these two expenditures into a single one to describe the phenomenon. It was also decided to compare only figures within social expenditure, rather than with education, defense, etc., in order to remain focused on the issue of public social expenditure.
Share of Resident and Non-Resident Pension Recipients
Share of Resident and Non-Resident Pension Recipients
The evolution of the share of pensions paid to residents and foreigners makes it possible to distinguish the share of pensions that potentially returns to the Luxembourgish economy. Viewing pensions and healthcare solely as expenditure is, once again, a bias. Paying pensions to residents who then spend in Luxembourg creates a virtuous circle and a "return on investment", whereas paying them to people residing abroad does not. This is why it is appropriate to observe this dimension, especially in the case of Luxembourg, which has more pensioners residing abroad than on its territory.
Share of Resident and Non-Resident Pension Recipients
The evolution of the share of pensions paid to residents and foreigners makes it possible to distinguish the share of pensions that potentially returns to the Luxembourgish economy. Viewing pensions and healthcare solely as expenditure is, once again, a bias. Paying pensions to residents who then spend in Luxembourg creates a virtuous circle and a "return on investment", whereas paying them to people residing abroad does not. This is why it is appropriate to observe this dimension, especially in the case of Luxembourg, which has more pensioners residing abroad than on its territory.
Although the purpose of the project was primarily the approach rather than the analysis of the figures presented, the "story" being told remains relevant to observe.
The figures therefore show a geographical disparity and an overall situation that is becoming more pronounced and will continue to become more pronounced in the future, regardless of the scenarios considered.
Population ageing significantly impacts public expenditure, both through healthcare and pensions, especially since the majority of pensions may not support consumption and the Luxembourgish system.
The project carried out during this approximately two-and-a-half-day hackathon was therefore based on two key points derived from the skills and knowledge already present within the Artemis team. The simplified evaluation matrix ensured transparency in the approach, while supporting a certain level of rigor and neutrality. The dashboard, based on open-source data and software, in turn provided a customizable, understandable, and reproducible "picture" of official statistics addressing the issue.
Nevertheless the analysis could not be further developed through evaluative and econometric approaches due time constraints, which remains the main limitation of the project. Finally, although the objective was a certain level of popularisation and simplicity, the trade-off between simplicity and superficiality can be mentioned.
Regardless of the outcome, the hackathon was a particularly stimulating experience, both in terms of team building and skills development. Working within a short timeframe towards a single objective encouraged us to seek innovative solutions, build on each team member's skills while further developing them, and compare Artemis's ways of working with those of the other teams. In addition, the feedback and discussions with the judges about the results were both interesting and stimulating, highlighting the strengths and weaknesses of the approach adopted by the team. Overall, it was a highly rewarding experience, which is why Artemis has chosen to participate in future Hackathons.
Share this article
Lorem ipsum dolor sit amet, consectetur adipiscing elit, sed do eiusmod tempor incididunt ut labore et dolore magna...